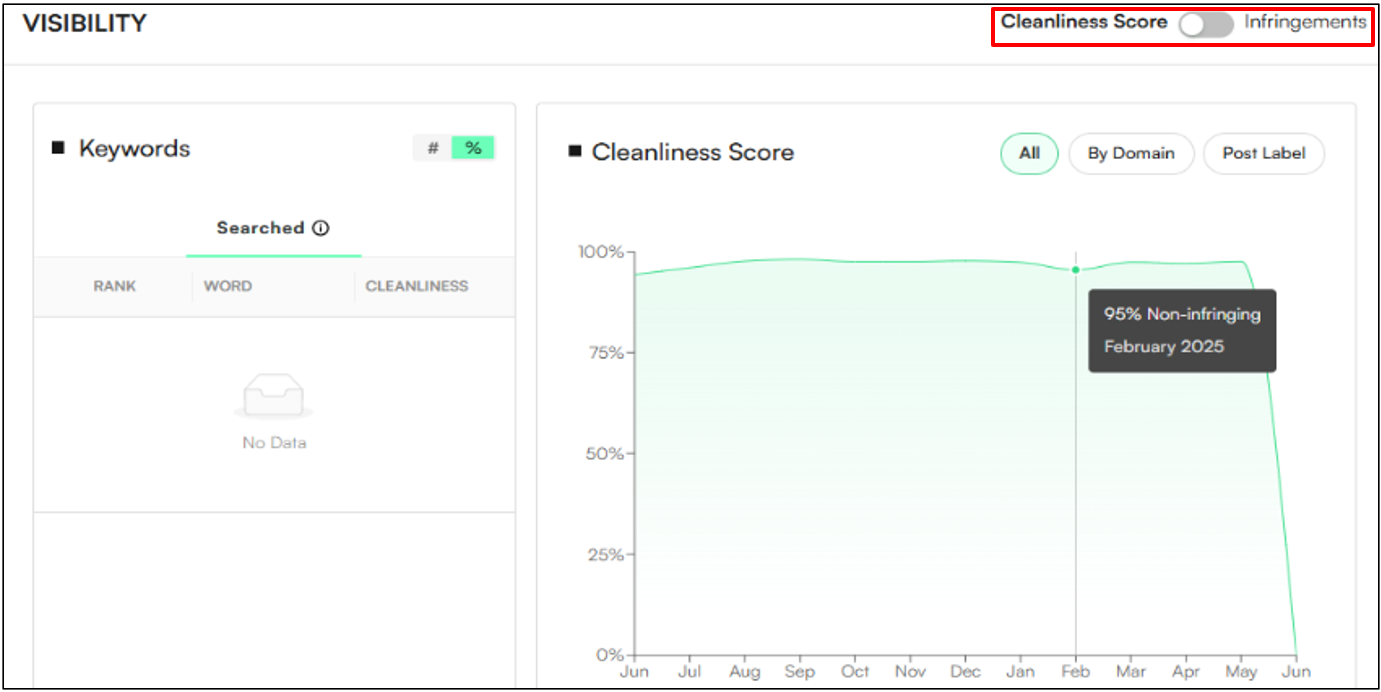
In the Dashboard, under the Visibility section, the Cleanliness Score™ shows how many posts about your brand are “clean” (legitimate) versus “dirty” (infringing or suspicious). It’s a simple percentage:
100% = everything is clean
0% = everything is problematic
Most brands will fall somewhere in between
Cleanliness Score Toggle: ON
Users can assess how free specific platforms or domains are from infringements, using keyword-based metrics:
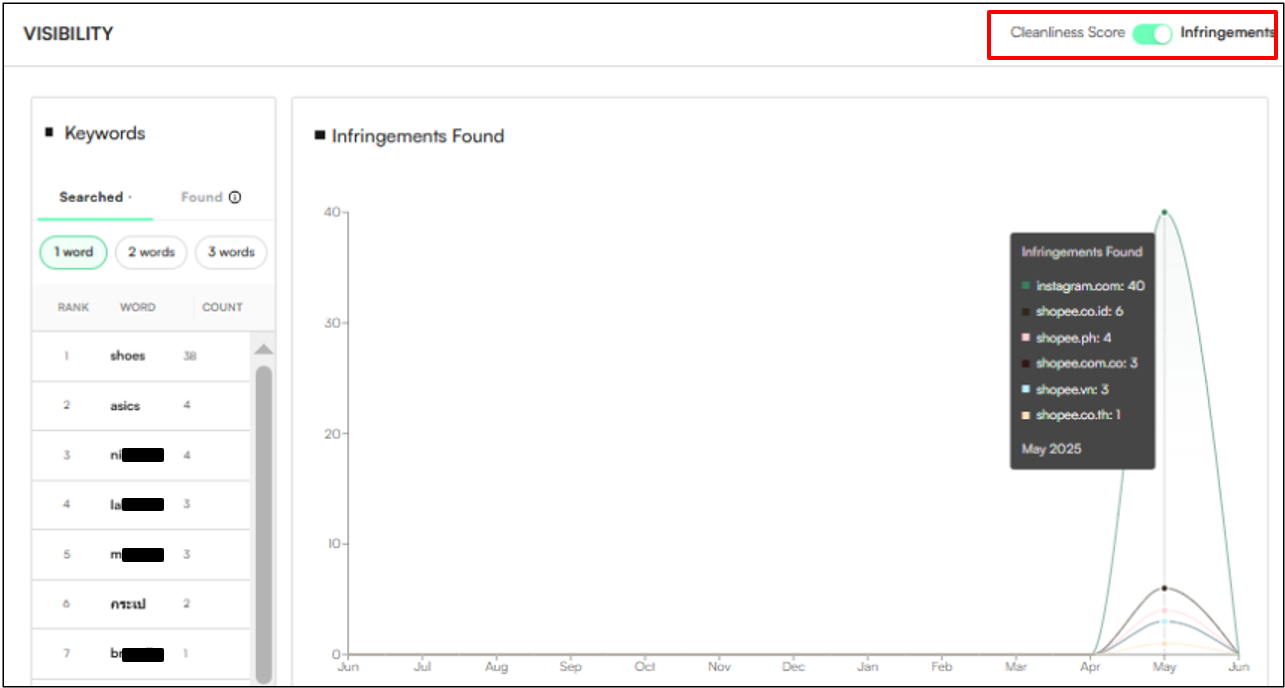
Infringements Toggle: ON
Users can identify which keywords are generating the highest volume of infringing results:
The Cleanliness Score reflects the Cumulative Search Impact, focusing on true consumer exposure across an expanded audit depth.
Top-100 Depth: Audit of the first 100 results for every keyword marked as a Priority Keyword (⭐).
Cumulative Accounting: Account for every instance of an infringing result. If the same "dirty" post appears in search results for multiple keywords, it is counted as an infringing instance every time it surfaces to a potential customer.
Classification of "Dirty" Posts: Each result in the Top 100 is checked against two criteria:
Infringing Moderated Posts: Results that have already been flagged or labeled as violations (e.g., counterfeit, trademark infringement, policy violation, etc.).
Improved AI Risk Predictions: Unmoderated posts with an improved Risk Score > 0.7.
Keyword Extraction: Relevant keywords are extracted from each post, but only those you have marked as priority keywords are included in the final calculation.
The Formula:
The cleanliness score is calculated based on total appearances across the search landscape:
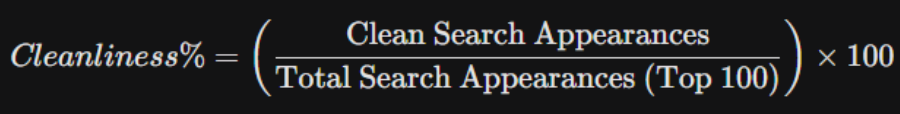
Example: If your priority keywords generate a total of 100 search result instances, and 70 are clean while 30 are "dirty" instances, your score is 70%.
Keywords Table: A breakdown of clean vs dirty posts for each keyword.
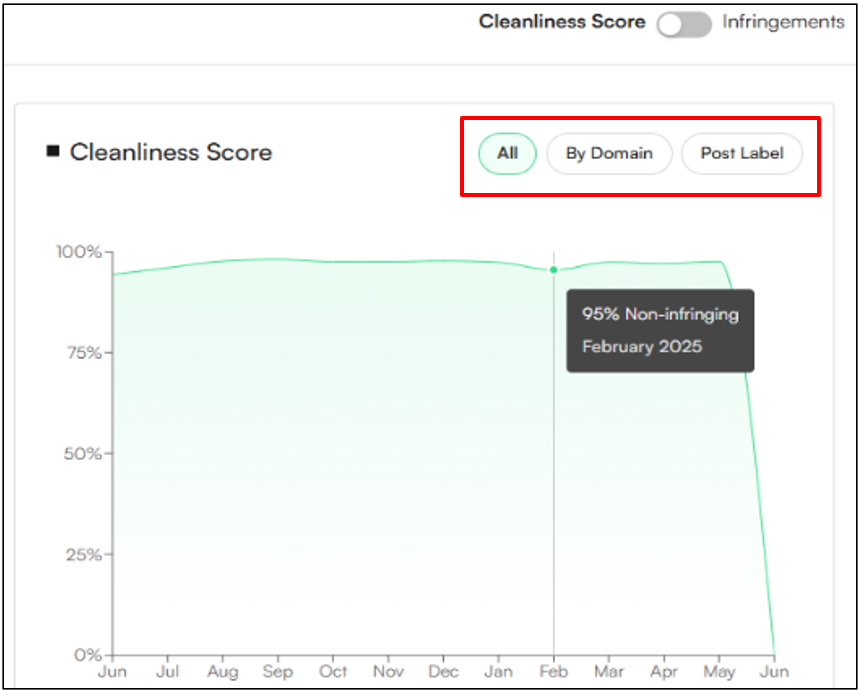
Graphs:
- All Graph → Trends over the last 12 months
- By Domain Graph → Breakdown by website or platform
- Post Label Graph → Breakdown by label (e.g., counterfeit, grey market, etc.)
👉 In short: The cleanliness score tells you how healthy your brand environment is online, using your priority keywords as the lens.
