The Dashboard is the central hub of Zeal 2.0, providing a quick overview of key metrics and essential information. It features visualisations, real-time updates, and shortcuts to important sections. The Dashboard is divided into six different sections.
Dashboard Sections
📌 Key Figures: View the number of posts and accounts that were taken down.
🔎 Visibility: Track the most infringing keywords.
📊 Data Breakdown: Identify the top infringing accounts, regions, products, images, and sites.
🛡 Moderation Statistics: View breakdowns of moderated content and infringement types.
⚖ Takedown Statistics: See platform responsiveness and overall enforcement efficiency.
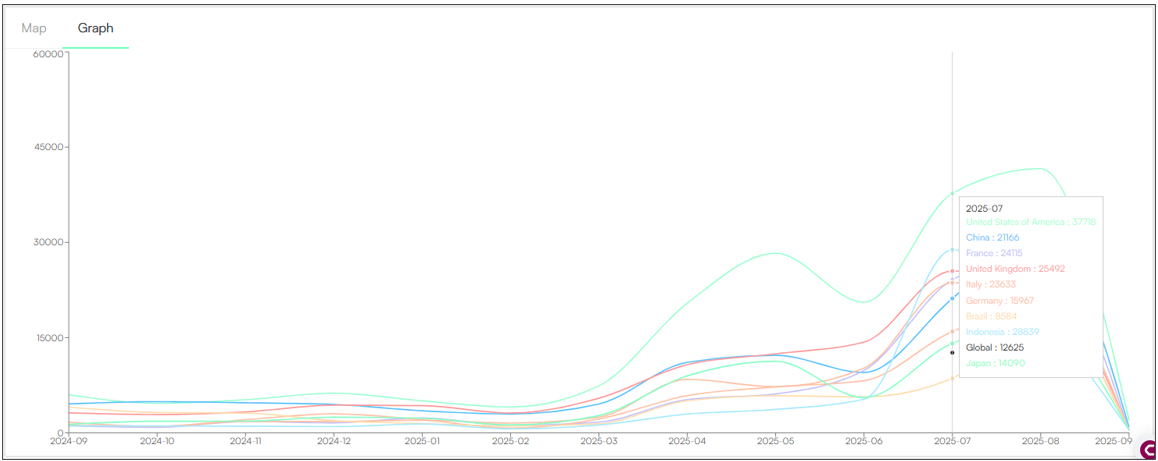
🌍 Map/Graph: Visualise geographic pain points and monitor how regional infringement trends evolve.
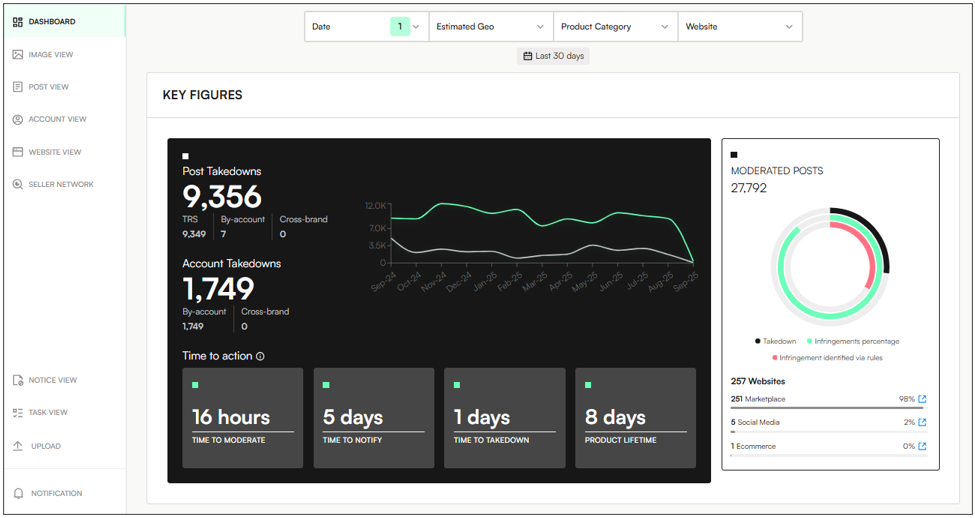
KEY FIGURES
The Key Figures section of the Dashboard offers a snapshot of enforcement activity within a filtered timeframe. It displays the following information:
📌 Posts & Accounts Taken Down – Total numbers tracked during the selected period (set by default to Last 30 Days).
📈 Takedown Trends – A dynamic graph that shows fluctuations of takedowns in the last 12 months.
⏱ Time to Action:
Time to Moderate – Average time to review and flag infringing content.
Time to Notify – Time to alert platforms for action.
Time to Takedown – Time from detection to takedown.
Product Lifetime – How long posts have remained online since detection.
🛡 Moderated Posts:
% of infringements identified.
% detected via brand-defined rules.
% of successful takedowns based on flagged content.
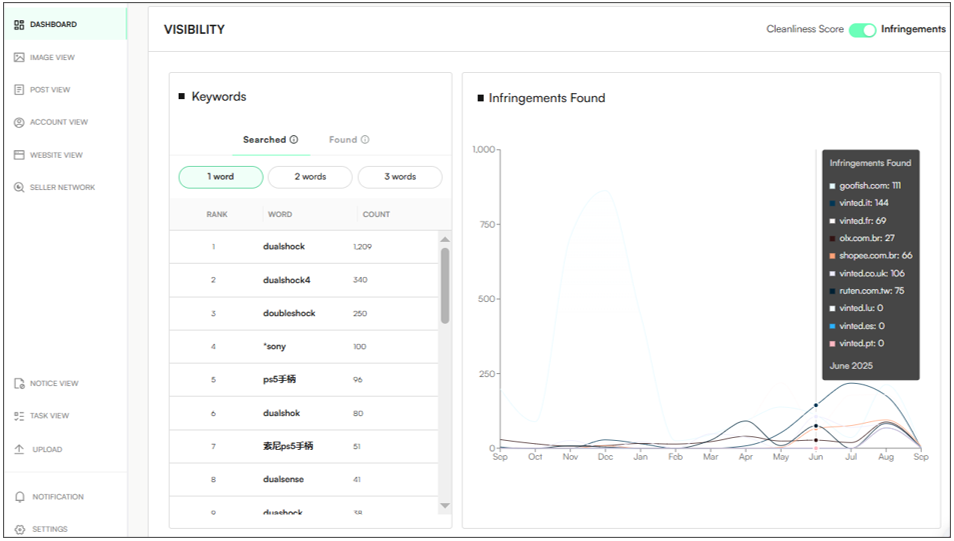
VISIBILITY
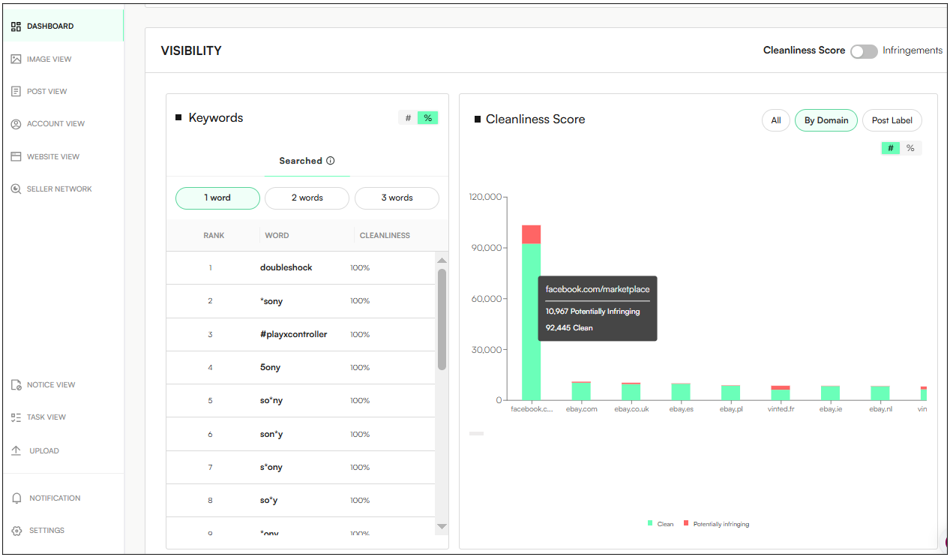
The Visibility section of the Dashboard provides insights into keyword performance related to infringement detection.
🔎 Infringements Toggle: ON – Users can identify which keywords are generating the highest volume of infringing results. Clicking on a keyword refreshes the graph to show all detections associated with that specific keyword:
"Searched" terms – Keywords manually configured in the system to track potential infringements.
"Found" terms – Automatically detected by the system based on their frequent appearance in infringing posts.
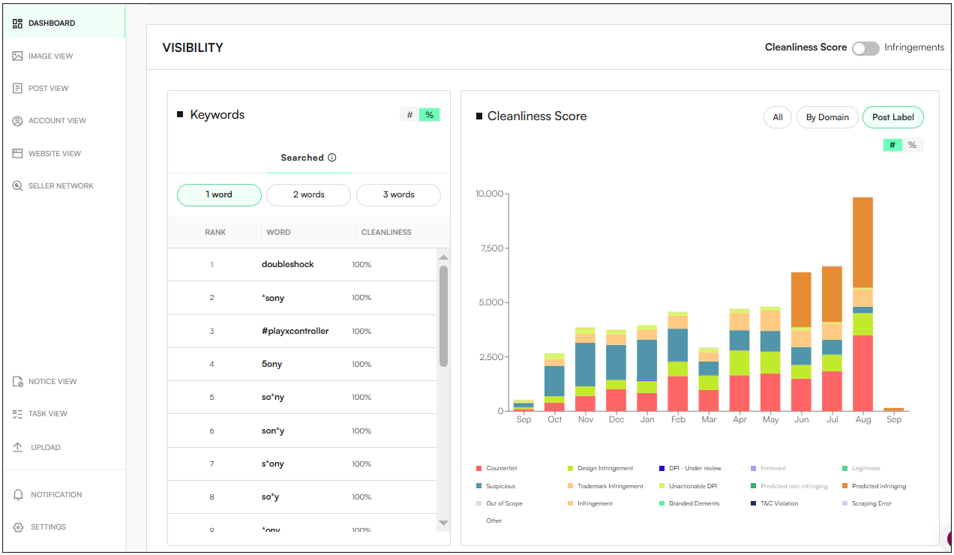
🧹 Cleanliness Score Toggle: ON – Users can also assess how free specific platforms or domains are from infringements, using keyword-based metrics.
All - Displays overall cleanliness across all domains and keywords in the last 12 months:
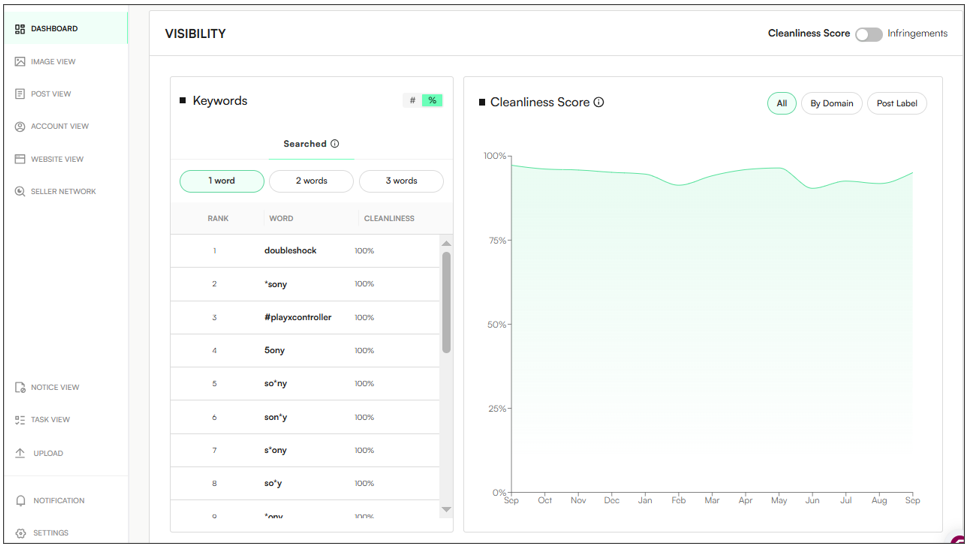
By Domain - Displays the number of posts that are potentially infringing by domain/platform:
Post Label - Displays the number of posts and their label (infringement type) in the last 12 months:
DATA BREAKDOWN
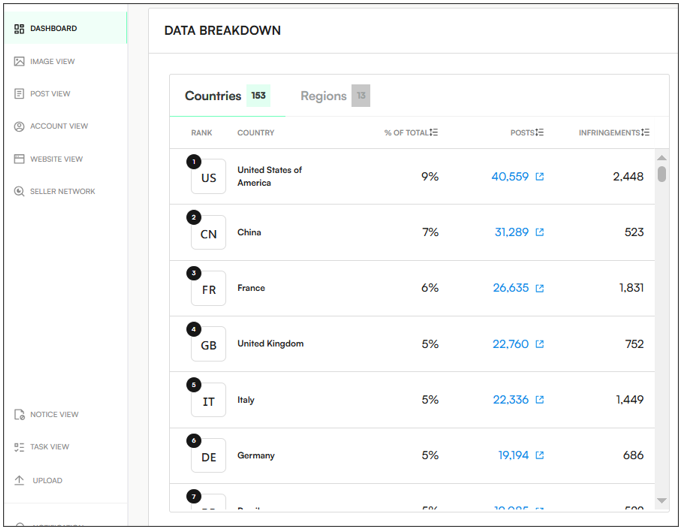
The Data Breakdown section of the Dashboard provides geographic and category-based insights into infringement activity, displaying the following:
🌍 Top Countries & Regions – Geographic locations where infringements are the most popular:
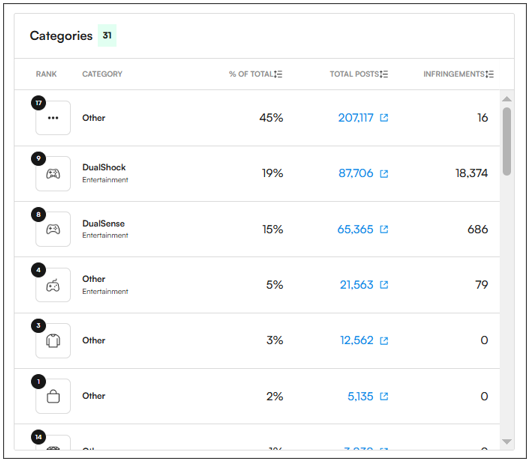
📦 Top Products and/or Categories – Products or categories that are the most infringing.
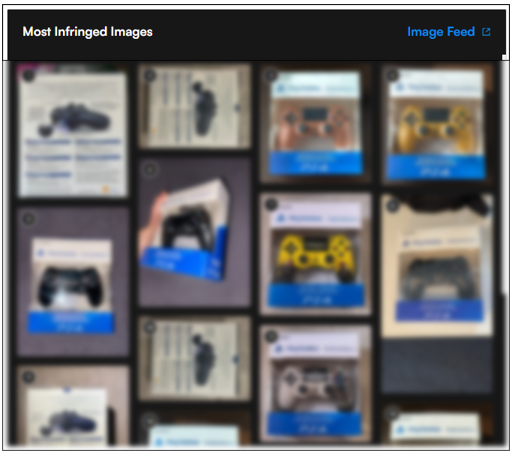
🖼 Most Infringing Images – Showcases the images that appear most often in infringing posts:
👤 Top Infringing Accounts/Sellers – Sellers or accounts responsible for the most infringing posts.
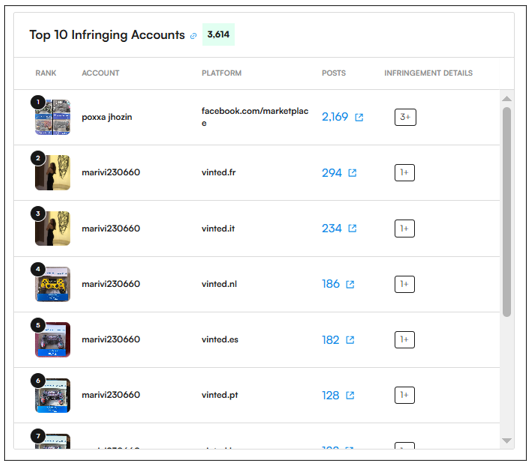
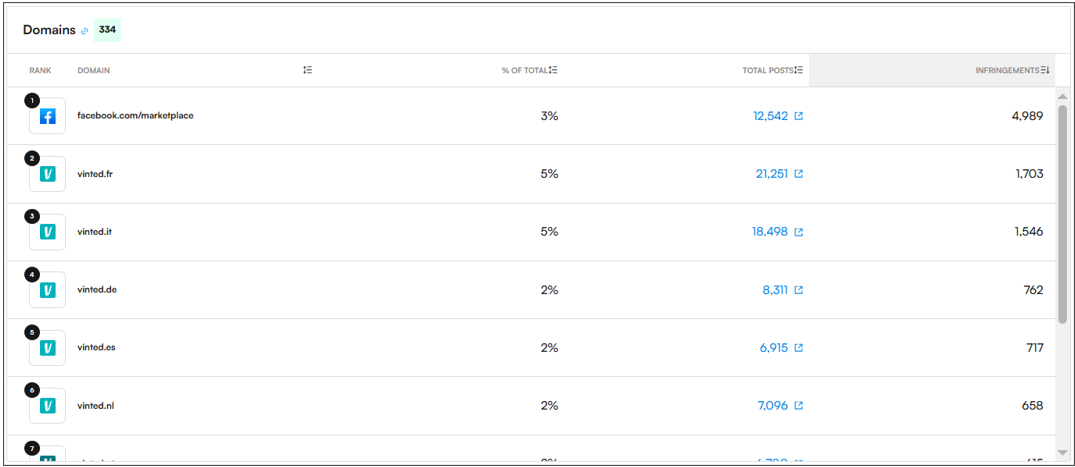
🌐 Top Infringing Domains/Sites – Displays the websites, marketplaces or platforms hosting the most infringing content.
Each section contains links that direct to the associated posts.
MODERATION STATISTICS
In the Moderation Statistics section of the Dashboard, users can access a detailed breakdown of the following information across posts, images and accounts/sellers:
📝 Moderated – A moderator has reviewed a post, image, or account, and an initial decision has been made (e.g., marked as infringing or clean). This is the first layer of content evaluation.
🔍 Checked – The item has been reviewed by a Quality Analyst (QA) to verify the moderator’s decision.
✅ Validated – The content has been final-reviewed and confirmed as correct, often by a user with validation permissions (e.g., client-side or internal validator). Validated items are locked in and ready for enforcement.
🎯 Accuracy – Average accuracy of moderation for the observed posts.
⚡ Actionable Items – Number of enforceable posts out of the observed posts.
🏷 Logo Detected – Number of posts where the brand logo was detected.
📊 Risk Score (NS) – Average NS Score found across all observed posts.
🆕 New – Images/Accounts observed for the first time during the selected time period.
♻ Existing – Number of images/accounts that were found during the selected time, but had already been previously seen by Corsearch.
📑 Labels/InfringementType Breakdown
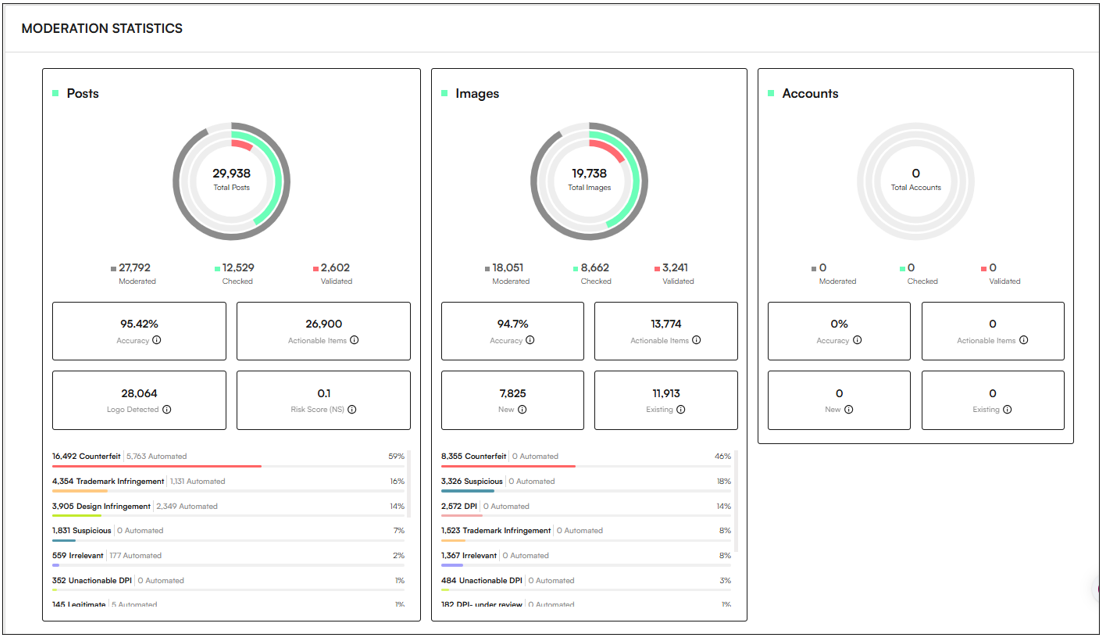
Note: Don’t forget to click View More to expand the Moderation Statistics window, displaying the infringement breakdown for posts, images and accounts.
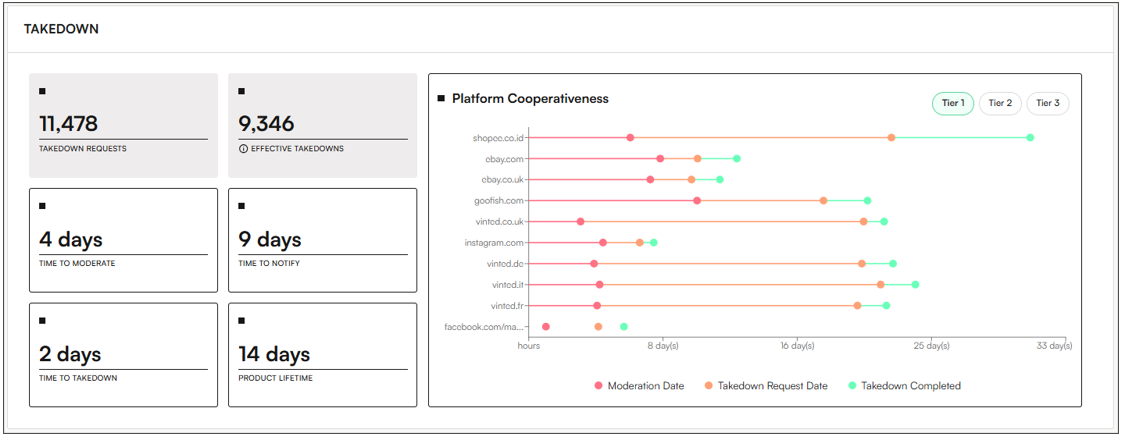
TAKEDOWN STATISTICS
The Takedown Statistics section provides an overview of enforcement outcomes, helping users understand how many infringing posts have been successfully removed across filtered timeframes. The Takedown section displays:
⏱ Time to Action:
📌 Takedown Requests – Number of enforced posts.
✔ Effective Takedowns – Number of enforced posts that are now successfully removed (if hovering over the information symbol it will display the percentage of removed posts).
📝 Time to Moderate – Average time to review and flag infringing content.
📢 Time to Notify – Time to alert platforms for action.
⚡ Time to Takedown – Time from detection to takedown.
⏳ Product Lifetime – How long posts remained online since detection.
📊 Platform Cooperativeness – A graph displaying the platform's compliance and response times, divided by tiers. The chart groups domains into three tiers based on their priority and the amount of data available for each.
MAP & GRAPH
The Map/Graph section displays visual graphic information of actionable items:
🗺 Map – Provides a visual representation of the online infringement landscape, using a colour gradient from green (low infringement) to red (high infringement) to highlight affected regions.
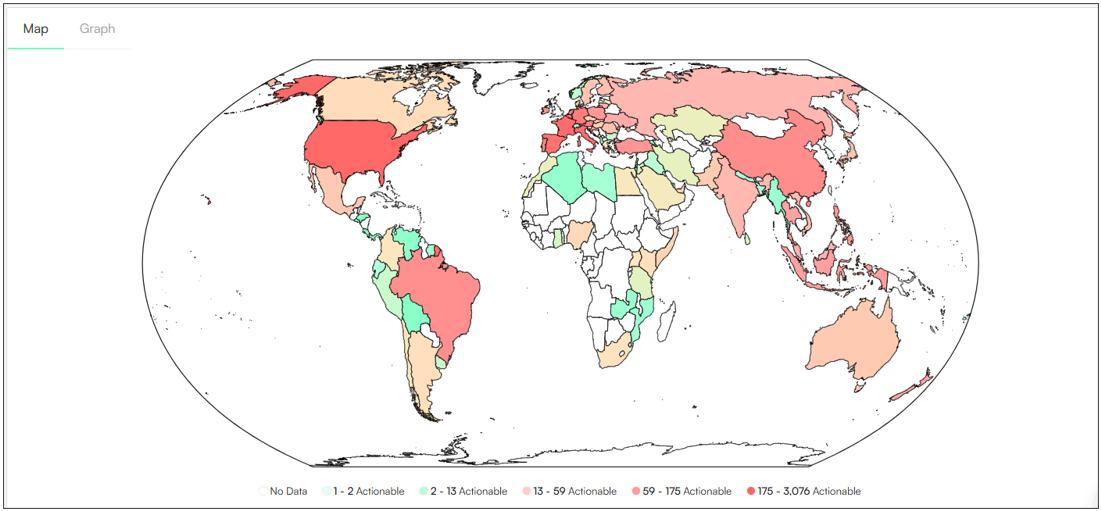
📈 Graph – Shows the breakdown and variation of infringements around the world in the last 12 months.